Glycemic variability and CGM: postprandial peaks and endothelium
Reading CV, TIR, and AGP; sensor chemistry, mitochondria, PARP/GAPDH, Brownlee's four branches, eNOS, and glycocalyx. Clinical findings, meal strategies, and limits of transferring targets between populations.
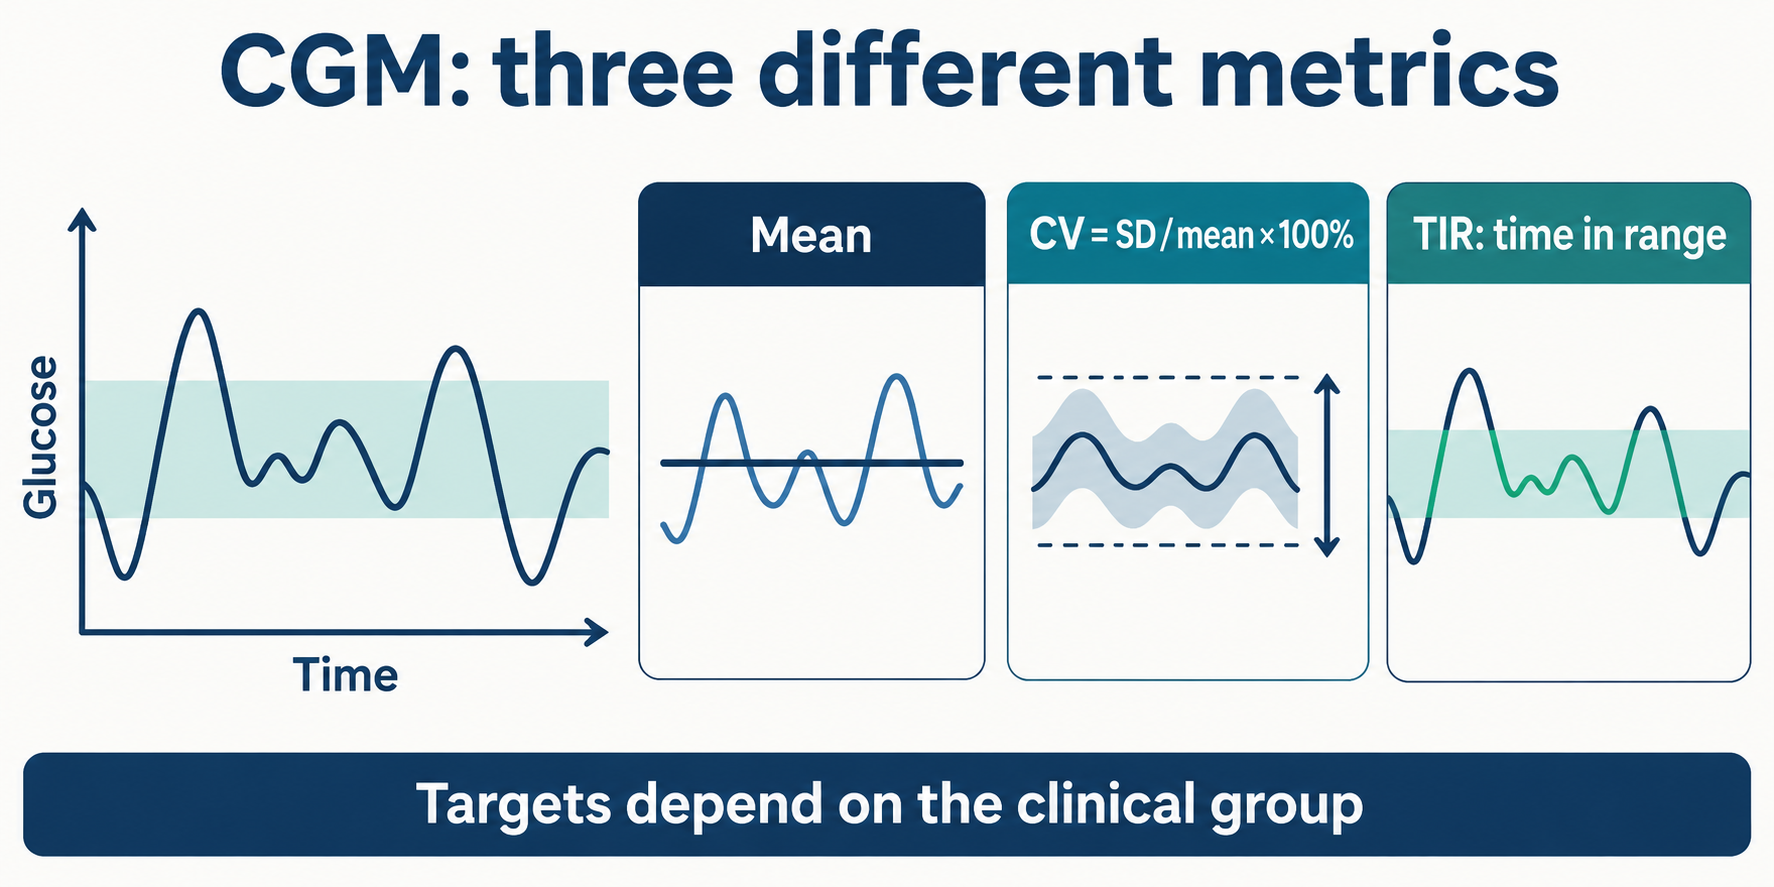
Mean glucose and glucose dynamics answer different questions
HbA1c forms through nonenzymatic glycation of erythrocyte hemoglobin, including the N-terminal valine of its β chains. It reflects roughly the preceding two to three months, with greater weight on recent weeks; erythrocyte lifespan does not make it a uniformly weighted average over exactly 120 days. Anemia, hemolysis, transfusion, some hemoglobin variants, and altered erythropoiesis can change its relationship to mean glucose. Its clinical value remains: DCCT and UKPDS linked improved long-term control to fewer microvascular complications. CGM adds a time profile rather than replacing the entire clinical assessment.
For continuous glucose concentration G(t) observed for time T:
G=T1∫0TG(t)dt.
Different curves can have the same integral. Hypothetical measurements 5, 7, 9 and 3, 7, 11 mmol/L both average 7 mmol/L but have different dispersion. This is a mathematical example, not a comparison of two patients' vascular outcomes. Equal HbA1c or a single peak cannot quantify an individual's relative myocardial-infarction risk. Diabetes duration, hypoglycemia, blood pressure, lipids, kidney function, smoking, and treatment matter.
Within-day variability includes postprandial and nocturnal fluctuations. Between-day variability and visit-to-visit HbA1c changes describe other timescales. A study of fasting capillary glucose cannot automatically be interpreted as a study of CGM-derived CV.
What fluctuation studies actually show
Monnier et al. (2006) examined 21 participants with type 2 diabetes and 21 matched controls, in a small case–control study rather than a 130-patient cohort. An association of MAGE with urinary 8-iso-prostaglandinF2α supports an oxidative-stress hypothesis but establishes neither causality nor a clinical MAGE cutoff or infarction prevention. The correct PMID is 16609090; 16609087 concerns a different subject.
Ceriello et al. (2008) found less favorable endothelial-function and oxidative-stress measures during experimentally controlled oscillating hyperglycemia than during the constant glucose exposures compared. An infusion experiment, cell culture, and an ordinary mixed meal differ in exposure, insulin, and lipids. FMD or nitrotyrosine changes are intermediate outcomes, not proof of a clinical catastrophe after every meal.
ACCORD found increased mortality with its intensive strategy in a high-risk population. This does not establish variability as the sole cause or imply that any low HbA1c is dangerous. Safe individualized goals and hypoglycemia prevention are priorities.
How CGM measures glucose
The sensor usually measures glucose in subcutaneous interstitial fluid. Electrochemical designs can use immobilized glucose oxidase, an FAD-containing flavoprotein. The principal chemical stages are:
The last line describes anodic peroxide detection in a corresponding design. Some systems use an electron-transfer mediator; oxygen dependence, electrode potential, membranes, interferences, and algorithms differ. Not every device has the same insertion depth, a platinum electrode, or MARD below 9%. MARD is a mean absolute relative difference against a selected reference in a particular study, not the maximum error of each reading.
Glucose moves between blood and interstitium. Lag depends on physiology, rate of change, insertion site, and signal processing; 5–15 minutes is an approximate description rather than a fixed correction. Fick's law for diffusive flux density is J=−D∇C, where D is the diffusion coefficient and C the concentration. Total transfer across a barrier can instead be expressed using permeability and area; these formulations should not be conflated. Pressure on the sensor, early wear, and medication interference can create artifacts. When symptoms and readings disagree, follow the device instructions and clinical plan, checking capillary glucose when indicated.
SD, CV, MAGE, and AGP
For N equally spaced readings Gi, the mean and sample standard deviation are:
Gi, the mean, and SD use the same units; CV is dimensionless. Software describing all recorded values as a complete population may use N in the denominator, so the reporting algorithm matters. Missing data and unequal intervals require attention to time. The three-reading examples above have sample SD 2 and 4 mmol/L and CV 28.6% and 57.1%. An SD of 3.5 mmol/L at means 14 and 5.5 gives CV 25% and 63.6%; it does not by itself establish coma.
Battelino et al. (2019) use CV≤36% as a stability target in diabetes, particularly relevant to treatment-related hypoglycemia risk. This is neither a biological threshold for oxidative injury nor a guarantee against hypoglycemia or a validated disease criterion in people without diabetes.
MAGE, introduced by Service et al. (1970), averages selected excursions exceeding one SD:
MAGE=k1j=1∑kλj,λj>SD.
λj is the selected excursion's amplitude and k the number selected. Direction and peak selection depend on implementation. MAGE has glucose units and omits some information on duration. No universal 3.9 mmol/L endothelial-toxicity cutoff is established, and MAGE is not a mandatory therapeutic target in contemporary standard reports.
AGP overlays multiple days on a 24-hour axis, displaying a median and distribution bands. The central band is usually 25–75%; outer bands may be 10–90% or 5–95%, depending on the report. Wide bands can reflect differences between days, while the median can hide individual lows. Representative 14-day recordings with at least 70% active data are a practical standard for interpreting many ambulatory profiles, not an independent criterion for diagnosing diabetes.
Schematic comparison of metrics, not patient data; axes have no numeric scale.
Glucose ranges and clinical populations
These 2019 consensus targets apply to most nonpregnant adults with type 1 or type 2 diabetes; ADA Standards 2026 emphasize individualization. TAR>180 includes time>250, and TBR<70 includes time<54. The targets are nested rather than mutually exclusive percentages to add together.
Metric
Range
Target
TIR
70–180 mg/dL, approximately 3.9–10.0 mmol/L
>70%
TAR
>180 mg/dL, >10.0 mmol/L
<25%
Level 2 TAR
>250 mg/dL, >13.9 mmol/L
<5%
TBR
<70 mg/dL, <3.9 mmol/L
<4%
Level 2 TBR
<54 mg/dL, <3.0 mmol/L
<1%
CV
SD relative to the mean
≤36%
70% of a day is 16 h 48 min; 25% is 6 h; 5% is 72 min; 4% is 57.6 min; 1% is 14.4 min. These convert percentages into time and do not define a safe minimum duration of an individual hypoglycemic episode. For older or high-risk people, the consensus proposes TIR>50% and time below 70 mg/dL<1%, emphasizing safety. Pregnancy with type 1 diabetes uses 63–140 mg/dL, approximately 3.5–7.8 mmol/L, and TIR>70%; this goal cannot automatically be applied to gestational diabetes or pregnancy with type 2 diabetes. There is no equivalent universally accepted set of therapeutic CGM targets for healthy people without diabetes.
Endothelial metabolism and mitochondria
GLUT1/SLC2A1 supports facilitated glucose transport without the insulin-dependent GLUT4 translocation typical of muscle and adipose tissue. However, insulin-independent transport does not mean an absence of insulin signaling or a complete inability to regulate GLUT1. Regulation varies by vascular bed and conditions; Totary-Jain et al. (2005) demonstrated adaptive GLUT1 regulation in vascular cells. A model of unregulated diffusion through an always-saturated transporter is insufficient.
In the cytosol, hexokinase converts glucose to glucose-6-phosphate. Endothelium predominantly uses glycolysis for ATP, while mitochondria remain important for signaling and redox balance. Pyruvate can enter the matrix through MPC, where PDH produces acetyl-CoA:
Pyruvate+NAD++CoA-SH→Acetyl-CoA+NADH+H++CO2.
Isocitrate, α-ketoglutarate, and malate dehydrogenases supply NADH; succinate dehydrogenase links the tricarboxylic-acid cycle to complexII. Electrons flow from complexesI/II through ubiquinone toIII, cytochrome c, andIV. ComplexesI,III,IV pump protons into the intermembrane space;II does not directly pump protons. Proton return through ATP synthase drives ATP synthesis.
Highly reduced carriers and a large proton-motive force can increase ROS production under some experimental conditions (Nishikawa et al., 2000). With the matrix defined as negative, hyperpolarization means a more negative ΔΨm, not “ΔΨm>−180 mV.” No universal clinical−180 mV threshold, complete respiratory-chain arrest after a meal, or thousandfold increase in radical lifetime is established. ComplexesI andIII can generate superoxide; reverse electron transport depends on the reduced Q pool and energetic state and is not obligatory after every glucose peak.
O2+e−→O2∙−,2O2∙−+2H+SODH2O2+O2.
Differences between superoxide, peroxide, and their compartments are explained in the article on mitochondrial SOD2. ROS also arise outside mitochondria; physiological signaling and damage depend on concentration, duration, and antioxidant systems.
Brownlee's hypothesis and four metabolic branches
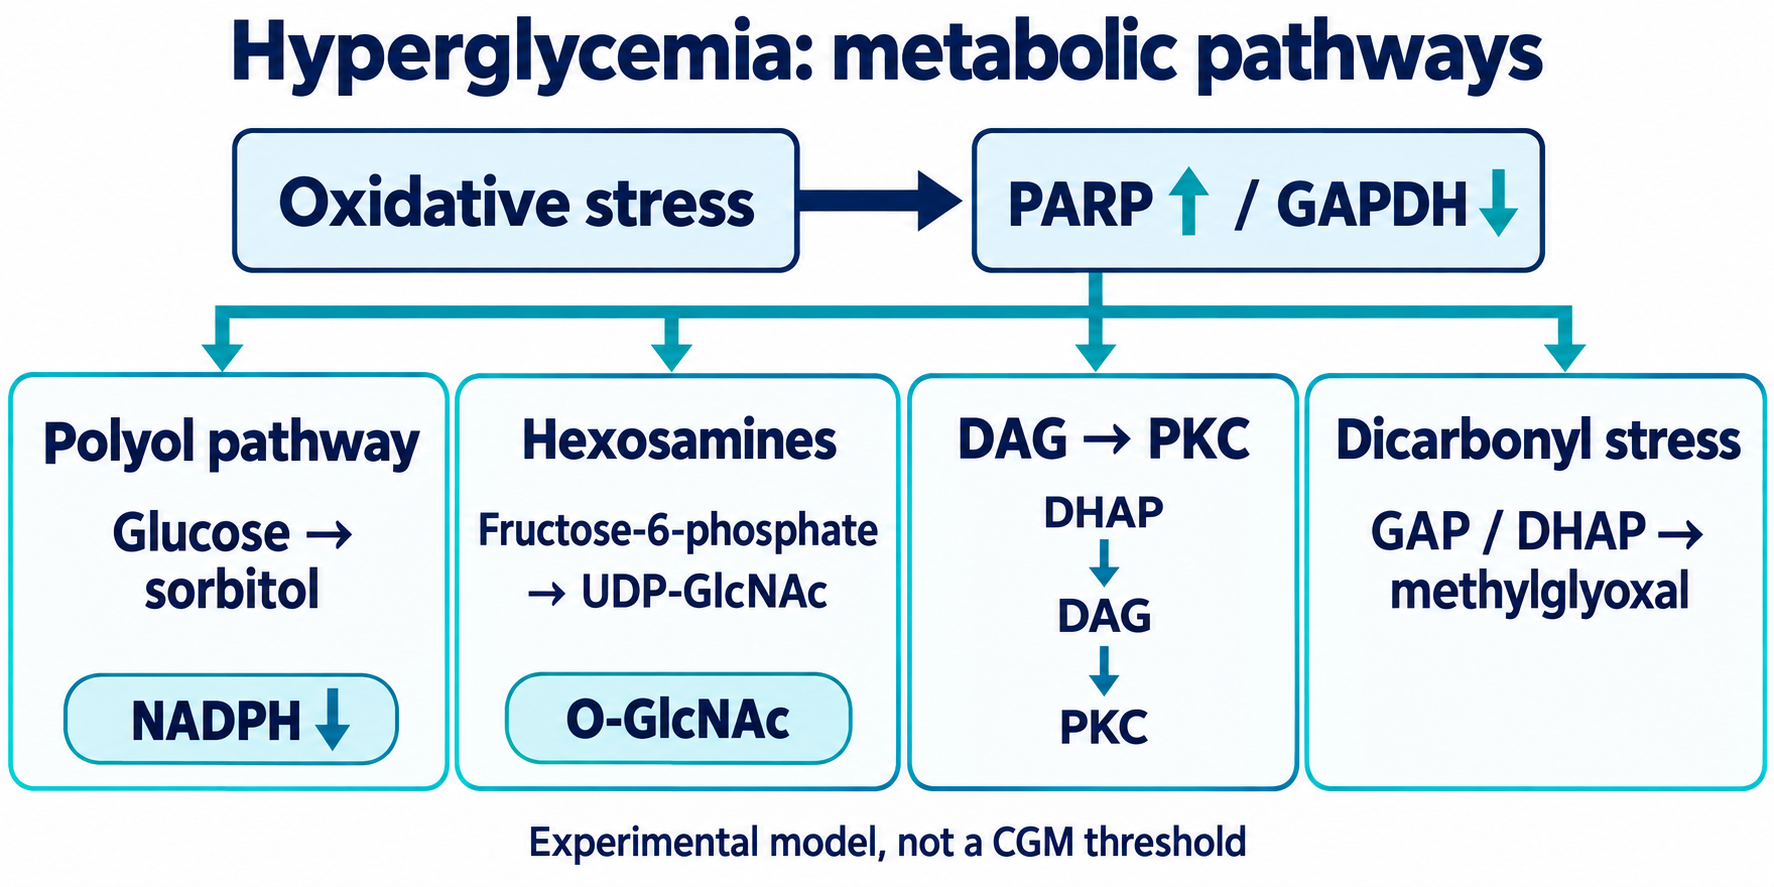
In Brownlee's model, DNA damage activates nuclear PARP 1, consuming NAD+ during poly(ADP-ribosyl)ation. Lower GAPDH activity changes upstream carbon distribution. Du et al. (2003) demonstrated this mechanism in endothelial cells and animal vessels, without establishing complete irreversible GAPDH inactivation specifically at Cys152 in humans after ordinary meals. PARP also participates in DNA repair; excessive activation can deplete NAD+ and energetic reserves.
The four branches should be distinguished by their actual starting substrates.
Polyol pathway. Aldose reductase AKR1B1 reduces free glucose, not glucose-6-phosphate, to sorbitol while consuming NADPH. Sorbitol dehydrogenase produces fructose and NADH. This can influence osmotic balance, NADH/NAD+, and NADPH availability for glutathione recycling; flux differs by tissue. Universal 30–35% flux and a tenfold fall in GSH/GSSG after every postprandial peak are unsupported.
Hexosamine pathway. GFAT uses fructose-6-phosphate and glutamine to form glucosamine-6-phosphate. Subsequent reactions produce UDP-GlcNAc; OGT transfers GlcNAc to protein Ser/Thr residues, while OGA removes it. Sp1 changes can influence TGF-β and PAI-1. Du et al. (2001) studied increased O-GlcNAc associated with reduced eNOS phosphorylation atSer1177; not all eNOS modification occurs at this single residue. O-GlcNAc is a regulated signal rather than an exclusively toxic process.
DAG–PKC. DHAP contributes to lipid and DAG synthesis through glycerol-3-phosphate. PKCβ and PKCδ activation can change endothelin-1, eNOS, VEGF, TGF-β, and NADPH-oxidase activity. NOX2 involves complex assembly with p47phox; NOX4 should not be described as having the same p47phox-dependent mechanism. Effects depend on isoform and cellular environment.
Dicarbonyl stress. Methylglyoxal can arise from GAP and DHAP triose phosphates, rather than from a reaction downstream of GAPDH. The glutathione-associated glyoxalase system limits its accumulation. Arginine and lysine modifications can yield MG-H1, argpyrimidine, and CEL. AGEs damage proteins and may activate RAGE, but different AGEs do not interact identically with the receptor. A universal “20000–50000 times” MGO reactivity figure is uninformative without specifying the reaction and conditions.
Simplified experimental model. Arrows indicate pathway directions, not a universal sequence after a meal; NADPH is consumed during glucose reduction.
NO, BH4, and the protective glycocalyx
eNOS/NOS3 uses L-arginine, oxygen, and reducing equivalents to produce NO and L-citrulline. NO regulates vascular tone and platelet/leukocyte interactions. Its rapid reaction with superoxide forms peroxynitrite:
NO∙+O2∙−→ONOO−.
The proportion reacting with NO depends on local NO, SOD, and other competing targets as well as reaction-rate constants. The entire NO pool therefore need not disappear instantly. BH4 oxidation and increased BH2 can impair eNOS electron-transfer coupling, shifting some activity toward superoxide formation (Kuzkaya et al., 2003). Uncoupling does not necessarily mean dissociation of every dimer; arginine availability and other protein modifications also matter. BH4→BH2 denotes a redox-state change here, not a complete balanced reaction with a sole product.
FMD assesses arterial dilation following increased flow and depends on methodology, baseline diameter, and many other factors. Experimentally reduced FMD cannot automatically be called spasm of all capillaries or assigned universal 8–12% and 2–4% values.
The luminal glycocalyx contains syndecans, glypicans, heparan sulfate, and hyaluronan, contributing to barrier function, mechanotransduction, and extracellular-protein retention, including ecSOD. Nieuwdorp et al. (2006) associated experimentally induced acute hyperglycemia with reduced estimated glycocalyx volume, endothelial dysfunction, and coagulation activation. This is not direct evidence of exactly halving its thickness in every person after meals. Heparanase and metalloproteinases can contribute to shedding; plasma syndecan-1 is not specific to this mechanism alone.
Inflammation, hemostasis, and target organs
ROS and metabolic signals can activate p 38/JNK and NF-κB. IKK promotes IκB phosphorylation and proteasomal degradation, allowing NF-κB to regulate inflammatory genes. E-selectin participates in leukocyte rolling, ICAM-1/VCAM-1 in firm adhesion, and MCP-1/CCL 2 in monocyte recruitment. Modified LDL uptake through CD 36 and other scavenger receptors contributes to foam-cell formation. Macrophages occupy a spectrum of states rather than all monocytes inevitably becoming M 1 cells.
Tissue factor initiates coagulation throughVIIa; PAI-1 inhibits plasminogen activators and fibrinolysis. These processes help explain diabetic atherothrombotic biology. They do not establish “one peak — cap thinning to 65 μm — rupture — infarction” as a universal clinical sequence.
In the retina, chronic diabetic stress affects pericytes, endothelium, VEGF, and occludin/ZO-1 barrier proteins, contributing to microaneurysms and macular edema. In the kidney, podocyte, nephrin/podocin, mesangial, and TGF-β changes relate to albuminuria and reduced filtration. In nerves, polyol metabolism, Na+/K+-ATPase function, and vasa-nervorum microcirculation interact with axonal and Schwann-cell injury. Pain and altered thermal or vibration sensation involve different fibers. These are mechanisms of diabetic complications, not proof of the independent contribution of every ordinary meal-related peak.
Lu et al. (2018) examined TIR and retinopathy in type 2 diabetes, without establishing universal doubling of progression risk at CV>36%. Beck et al. (2019) analyzed DCCT glucose profiles obtained through intermittent measurements: each 10-percentage-point lower TIR was associated with approximately 64% higher retinopathy risk and 40% higher microalbuminuria risk. This does not mean an intervention raising TIR by 10 points reduces all microangiopathy by 64%; inverse relative changes and causal effects differ.
HEART2D (Raz et al., 2009) found no advantage of the prandial strategy for its primary cardiovascular outcome: HR 0.98, 95%CI 0.80–1.21. The 2011 reanalysis also did not establish fewer events from lowering variability. DEVOTE2 (Zinman et al., 2018) studied between-day fasting self-monitored glucose variability; its MACE association lost statistical significance after major adjustments. These findings call for caution about independent CV causality.
Severe hypoglycemia can cause neuroglycopenia. Rapid decline from chronic hyperglycemia sometimes produces relative-hypoglycemia symptoms, but 4.5 mmol/L does not establish neuronal energy collapse or GLUT3 failure. Diabetes and vascular factors relate to cognitive risk; blood–brain-barrier, microglial, MGO, tau, and Aβ changes are mainly mechanistic links under investigation. “Type 3 diabetes” is not an official dementia diagnosis, and CGM does not diagnose dementia.
Food, movement, and supplements: outcomes versus promises
Viscous soluble fibers — psyllium, β-glucans, pectin, and glucomannan — can change mixing, enzyme access, and intestinal diffusion. Effects depend on viscosity, processing, and the meal (Jenkins et al., 1978; Vuksan et al., 2000). Insoluble fiber does not necessarily form the same gel, and complete elimination of peaks is not guaranteed. Dry swelling products require label-directed use and adequate fluid, especially with swallowing difficulties; medication separation should be discussed individually.
Phaseolamin from Phaseolus vulgaris inhibits α-amylase and affects starch digestion rather than all sugars. Kinetics depend on formulation and conditions; a universal 1000–1500 mg regimen guaranteeing 30–50% peak reduction is not established. DNJ from Morus alba is an iminosugar inhibiting intestinal α-glucosidases. Asai et al. (2011) studied an enriched extract in people with impaired glucose metabolism. That does not establish obligatory strong GLP-1 release or identical vascular effects from all commercial extracts. Gastrointestinal effects can occur; supplements do not replace diabetes care.
In cells and animals, berberine influences complexI, energetic state, and AMPK (Lee et al., 2006; Turner et al., 2008). AMP regulates AMPK activity and phosphorylation; this is not simply an allosteric action of LKB 1. Clinical glycemic studies, including Yin et al. (2008), do not establish MACE prevention. Dihydroberberine's pharmacokinetic advantages in particular models do not establish equivalent doses, long-term safety, or clinical superiority. Drug interactions and pregnancy use require separate assessment.
The chromodulin model proposes chromium participation in insulin signaling but does not establish universal chromium-picolinate benefit. GLUT4 is a transporter translocated to the membrane, not a channel that opens. Myo-inositol relates to phosphoinositide signaling and proposed inositol phosphoglycans; evidence from a particular population, such as PCOS, cannot be transferred to lowering CGM-CV in everyone.
Lipoic acid is an enzyme-complex cofactor in its bound lipoamide form; free acid and dihydrolipoate have different pharmacology. SYDNEY2 (Ziegler et al., 2006) assessed polyneuropathy symptoms rather than infarction prevention through CGM. The distinctions are explained in the article on R-alpha-lipoic acid and PDH. Neither that trial nor antioxidant biochemistry establishes a universal ALA, chromium, inositol, and berberine combination.
Behavioral strategies and safe use
Johnston et al. (2004) studied vinegar with a carbohydrate meal; a small acute experiment does not establish lasting 20–35% peak reduction or vascular protection. Acidity may irritate the esophagus and damage enamel; delayed gastric emptying can be undesirable in gastroparesis. Vinegar is not a required component of glucose management.
Shukla's 2015 and 2019 studies found some postprandial improvements when vegetables/protein preceded carbohydrates. The prediabetes paper appeared in 2019, not 2017. Different protocols do not establish three compulsory separate stages, universal 40–60% reductions, normalized CV, or reduced cardiovascular events. Meal order can be an optional practical addition while dietary quality remains central.
Reynolds et al. (2016) compared advice to walk 10 minutes after main meals with 30 minutes of walking without specified timing in type 2 diabetes. Muscle contraction promotes GLUT4 translocation through pathways involving AMPK and calcium-dependent mechanisms, without establishing prevention of a “mitochondrial threshold.” Exercise can increase hypoglycemia risk with insulin or secretagogues; activity should fit treatment and foot/cardiac status.
CLOCK/BMAL1/PER/CRY clocks, sleep, MT1/MT2 melatonin signals, and meal timing influence metabolism. Evening responses often differ from morning responses, but a fixed 19: 00–20: 00 boundary and universal 40–70% increase are not established. Schedule, shift work, chronotype, and medication matter; a late meal alone does not prove severe nocturnal oxidative stress.
Practical CGM use starts with an indication and a specific question. Review recording quality, hypoglycemia, recurrent patterns, and correspondence with HbA1c. Choose targets for the clinical group and adjust food, activity, and medication considering risk. After an agreed change, compare representative periods without promising vascular repair from CV alone. FMD, urinary isoprostanes, and hs-CRP are not a mandatory universal supplement-monitoring panel. Blood pressure, lipids, kidneys, eyes, and tobacco use remain preventive-care priorities that CGM cannot replace.
Interpretation limits
Mechanistic models explain why sustained pathological hyperglycemia can harm the vascular wall; they do not turn every physiological post-meal fluctuation into a toxic episode. Clinical CGM metrics help safe diabetes treatment but do not directly measure ROS, glycocalyx integrity, plaque rupture, or dementia risk. This is a scientific overview of mechanisms and selected primary studies with targeted corrections, without claims of systematic searching, GRADE assessment, or clinical validation of an author-created algorithm.
FAQ
Does CV above 36% mean vascular injury?
No. It is a stability target in diabetes relevant to treatment-related hypoglycemia risk, not a measurement of ROS or endothelial damage.
Should healthy people avoid every post-meal rise?
A physiological post-meal rise alone does not establish disease. Diabetes CGM targets cannot automatically be applied to people without diabetes.
Can CGM replace HbA1c and routine care?
CGM adds a temporal profile, but HbA1c, symptoms, treatment, blood pressure, lipids, and complication screening remain relevant.
Do supplements prevent infarction by flattening the curve?
Studies of particular glucose or symptom measures do not establish that prevention. A universal supplement combination is unsupported.